Connecting Databend With Grafana
What is Grafana?
The open-source platform for monitoring and observability.
Grafana allows you to query, visualize, alert on and understand your metrics no matter where they are stored. Create, explore, and share dashboards with your team and foster a data-driven culture.
-- From Grafana Project
Grafana
Create a Databend User
Connect to Databend server with BendSQL:
❯ bendsql connect
Connected to Databend on Host: localhost
Version: DatabendQuery v0.9.46-nightly-67b0fe6(rust-1.68.0-nightly-2023-02-22T03:47:09.491571Z)

❯ bendsql query
Connected with driver databend (DatabendQuery v0.9.46-nightly-67b0fe6(rust-1.68.0-nightly-2023-02-22T03:47:09.491571Z))
Type "help" for help.

dd:root@localhost/default=>
Create a user:
CREATE USER grafana IDENTIFIED BY 'grafana_password';
Grant privileges for the user:
GRANT SELECT ON *.* TO grafana;
See also How To Create User.
Install Grafana
Please refer Grafana Installation
Install Grafana Datasource Plugin
Go to grafana plugin page: https://grafana.yourdomain.com/plugins.
Search for
Altinity plugin for ClickHouse, click install.Go to grafana datasource page: https://grafana.yourdomain.com/datasources.
Click
Add data source, select previously installed source typeAltinity plugin for ClickHouse.Configure the datasource:
Necessary fields:
HTTP -> URLYour databend query clickhouse endpoint, for example:http://localhost:8124Auth -> Basic authenabledBasic Auth Details -> User, Passwordpreviously created grafana userAdditional -> Use POST method to send queriesenabled
tipFor Databend Cloud users, use the endpoint in
connect, for example:https://tnxxx--small-xxx.ch.aws-us-east-2.default.databend.com
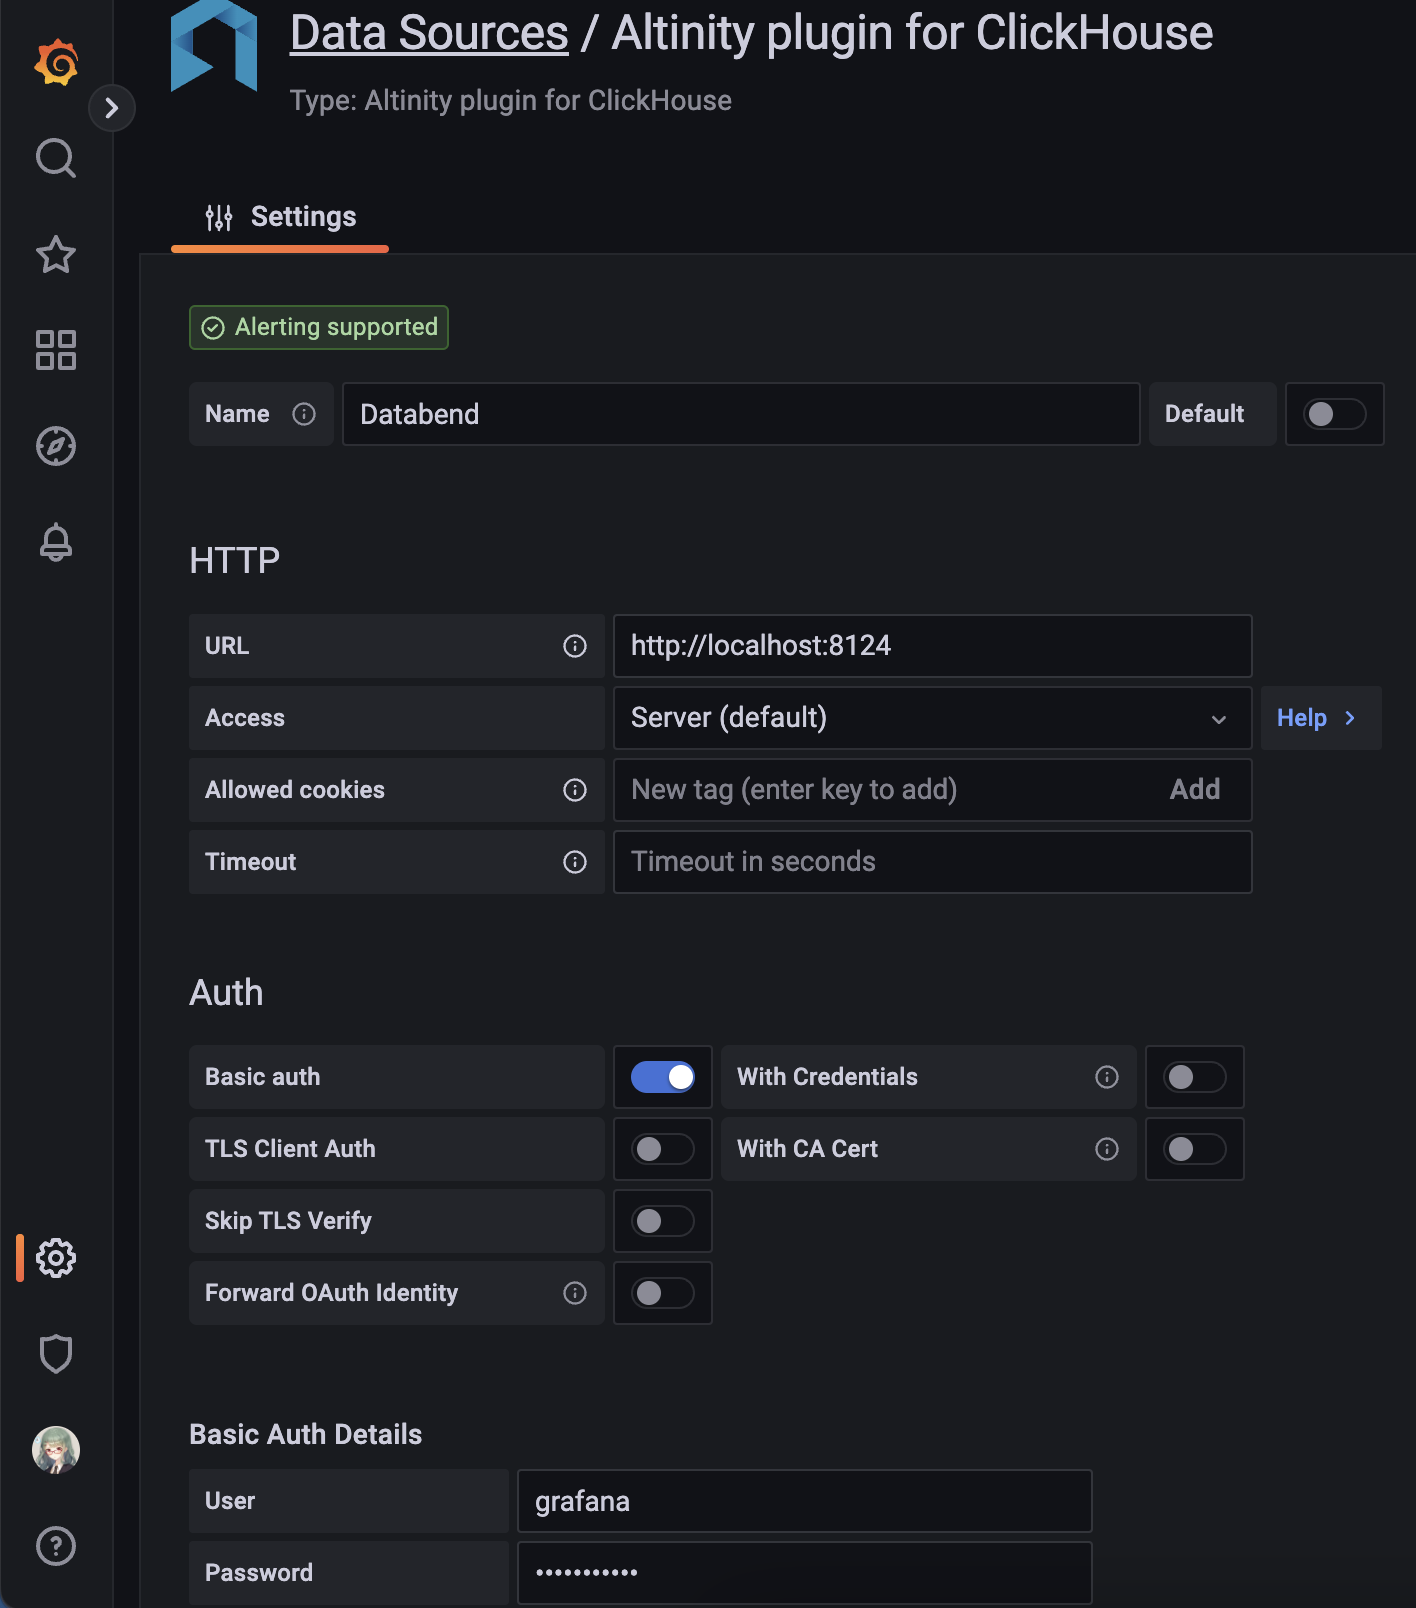
- click
Save & Testto verify datasource working.
Graphing with Databend
Here we use an existing nginx.access_logs as an example:
CREATE TABLE `access_logs` (
  `timestamp` TIMESTAMP,
  `client` VARCHAR,
  `method` VARCHAR,
  `path` VARCHAR,
  `protocol` VARCHAR,
  `status` INT,
  `size` INT,
  `referrer` VARCHAR,
  `agent` VARCHAR,
  `request` VARCHAR
);
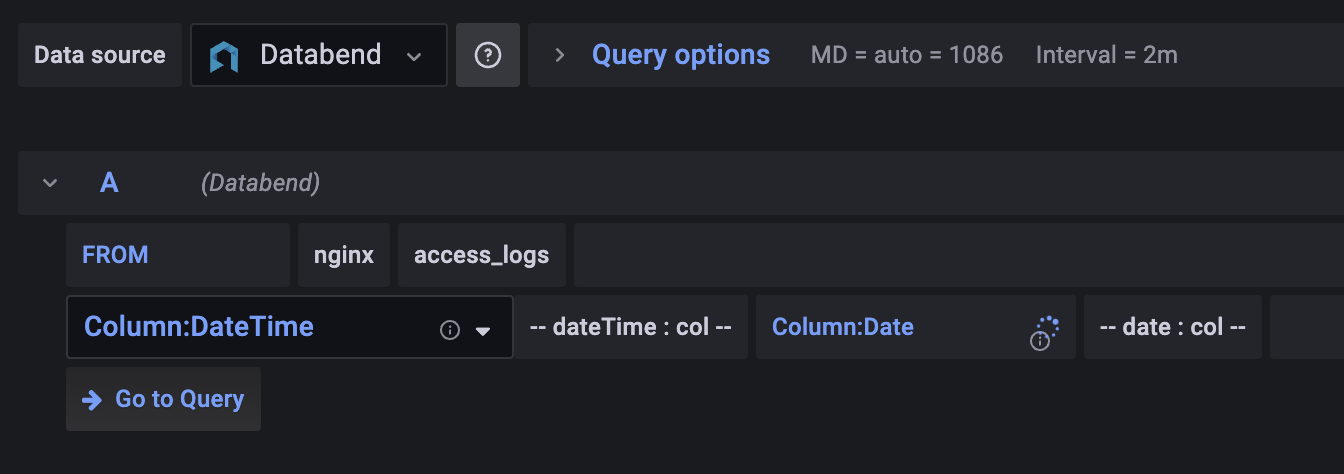
Create a new dashboard with a new panel, select the Datasource created in previous step.
Select
FROMwith database & table and clickGo to Query:
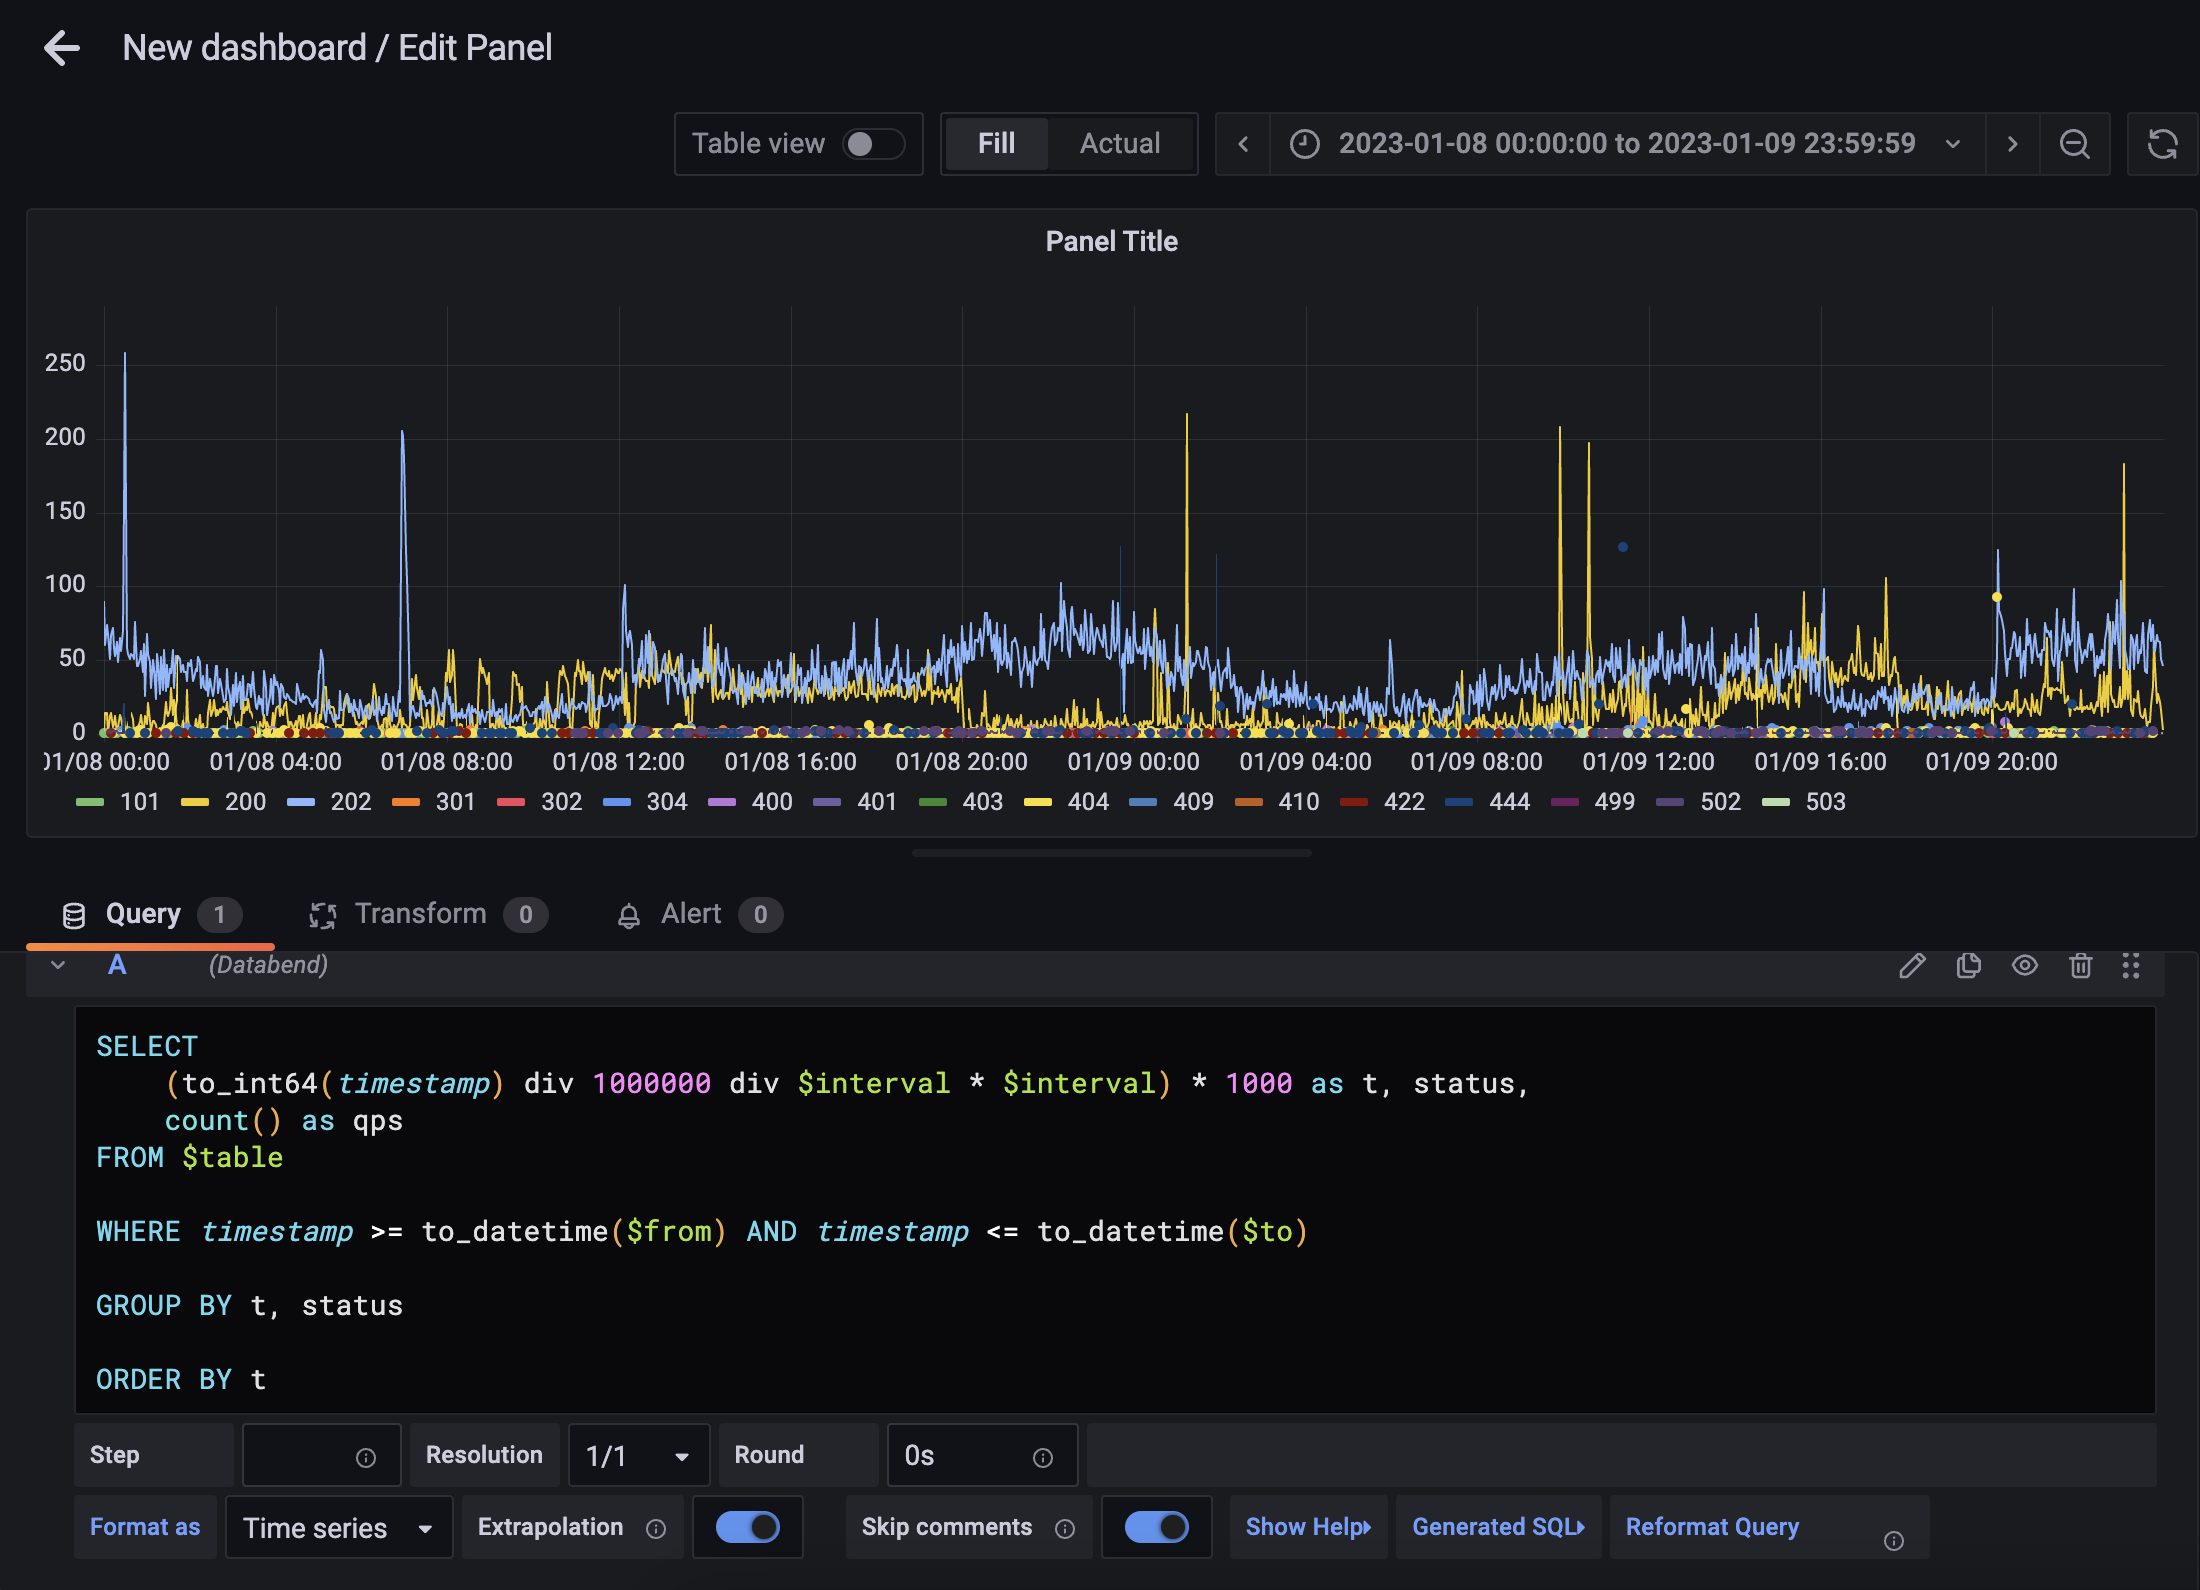
Input the query with some template variables:
SELECT
    (to_int64(timestamp) div 1000000 div $interval * $interval) * 1000 as t, status,
    count() as qps
FROM $table
WHERE timestamp >= to_datetime($from) AND timestamp <= to_datetime($to)
GROUP BY t, status
ORDER BY ttipYou can click
Show Helpfor available macros, some frequently used are:$intervalreplaced with selected "Group by time interval" value (as a number of seconds)$tablereplaced with selected table name from Query Builder$fromreplaced with (timestamp with ms)/1000 value of UI selected "Time Range:From"$toreplaced with (timestamp with ms)/1000 value of UI selected "Time Range:To"
Then you should be able to see the graph showing:
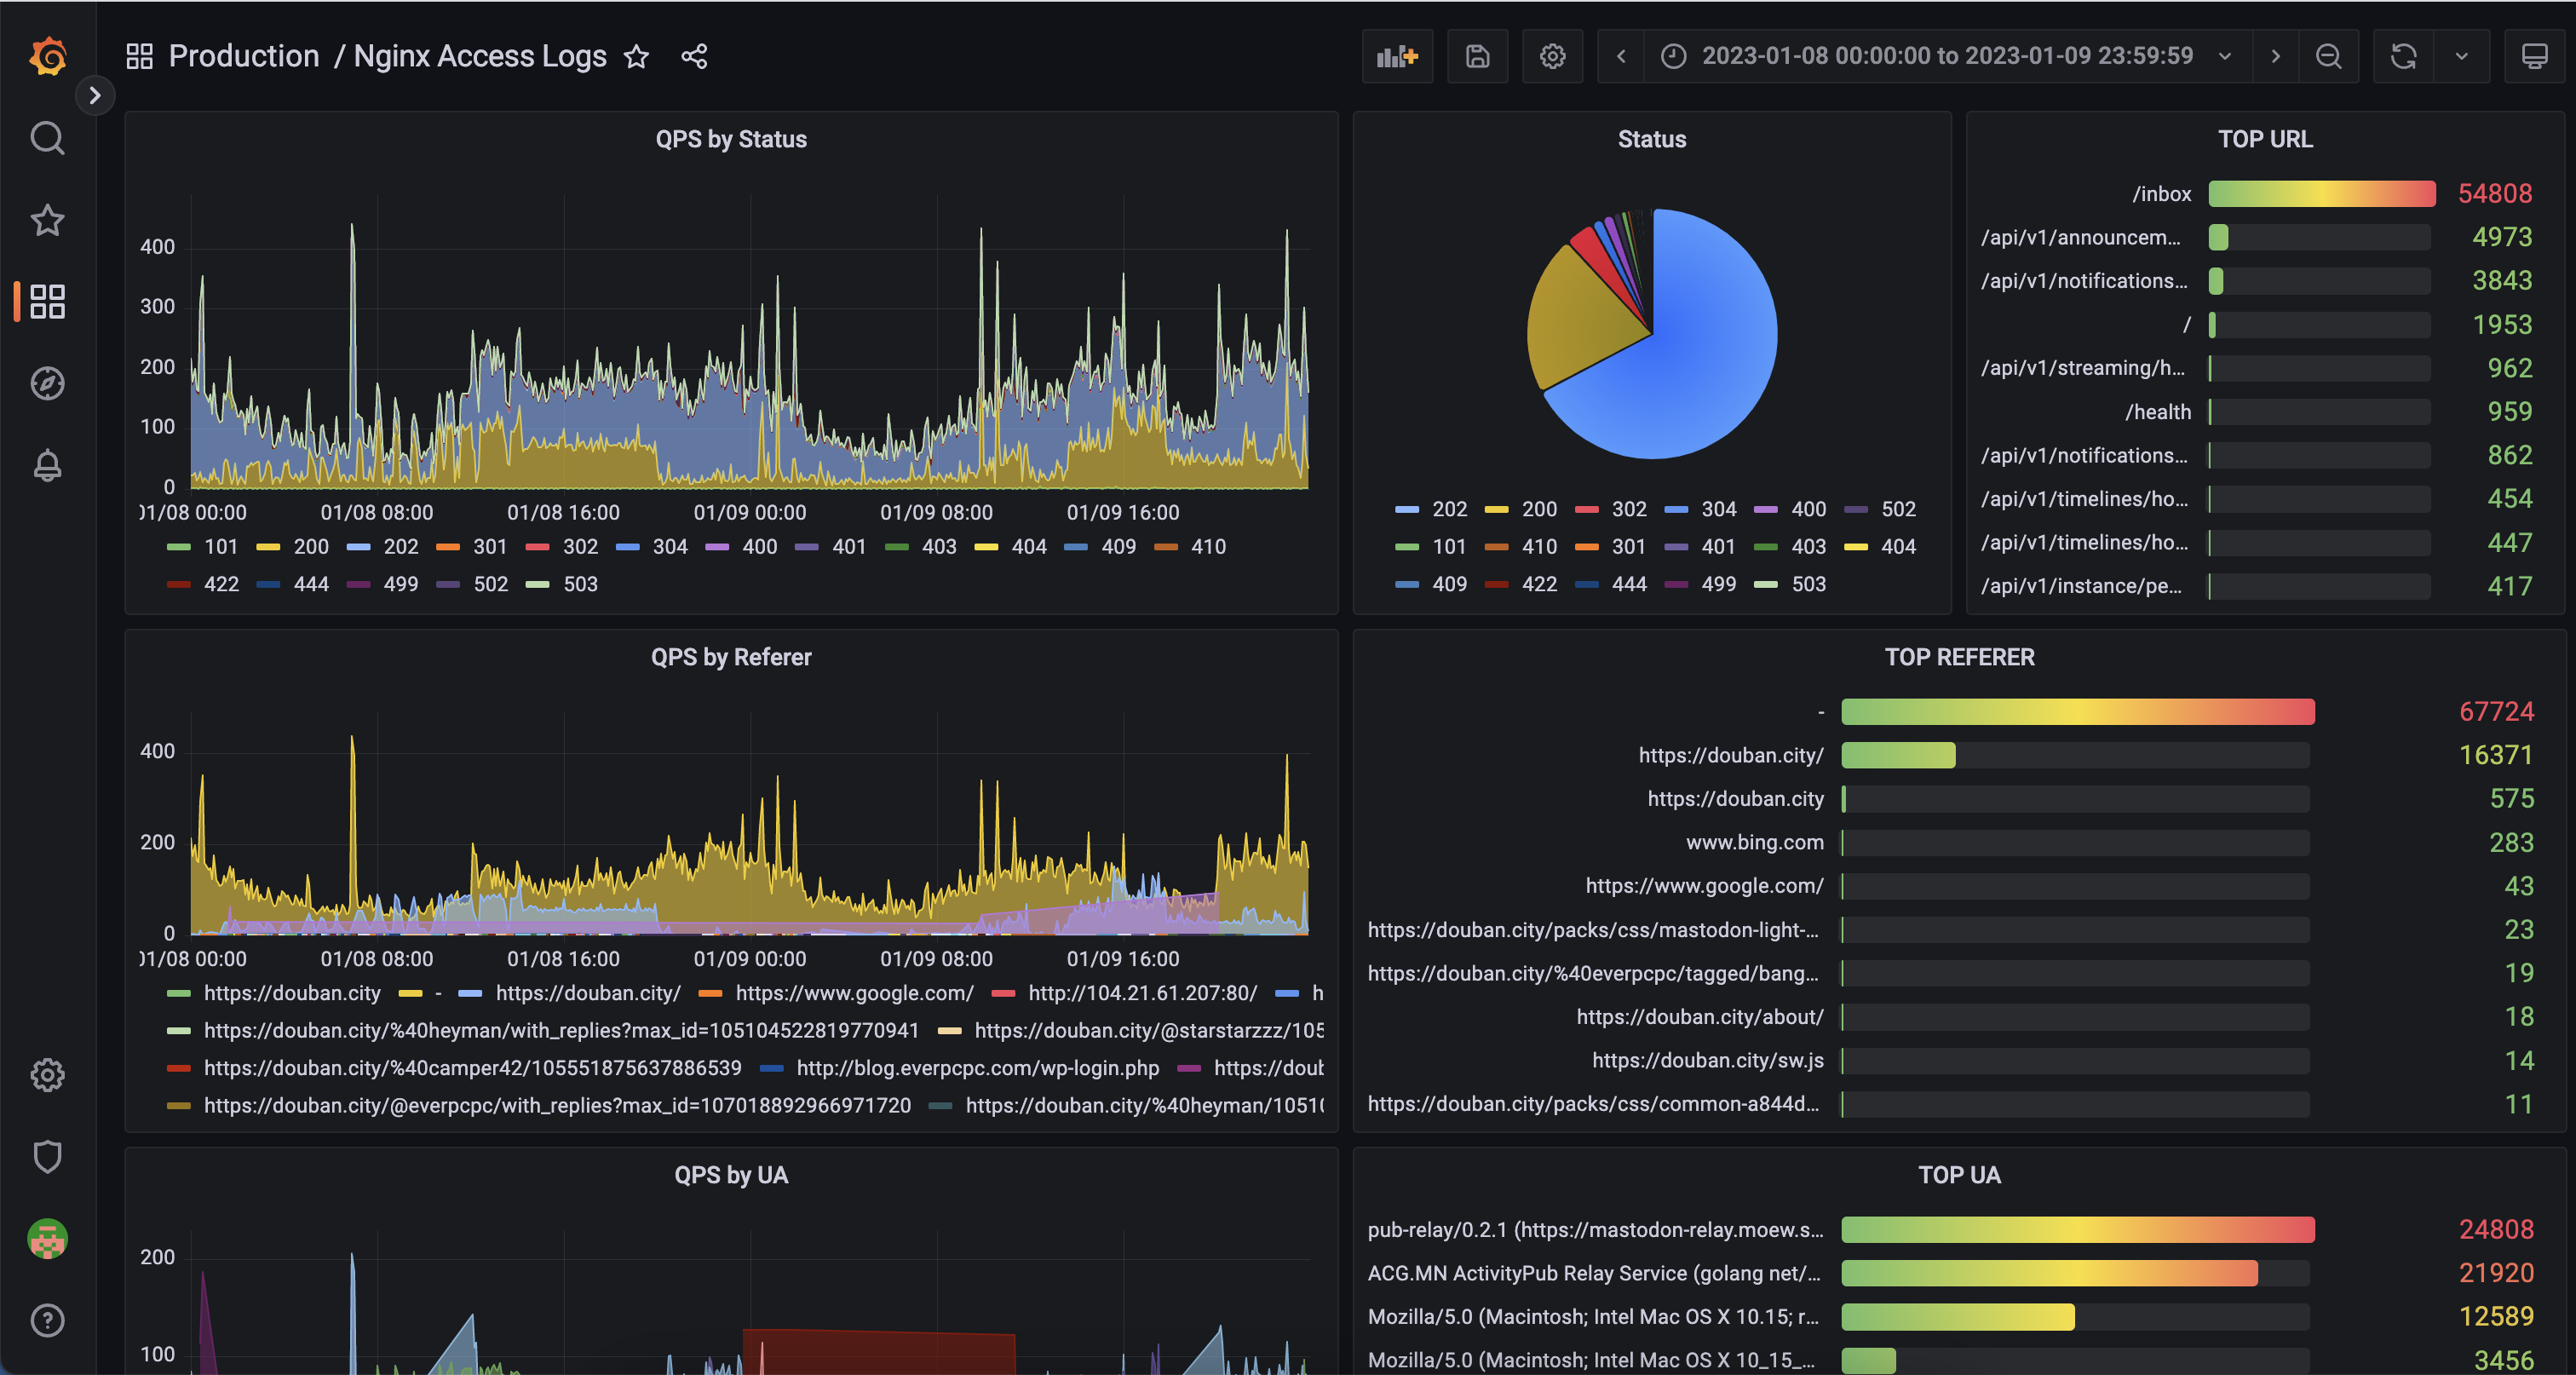
Adding more panels with this step, we could then have an example dashboard: